
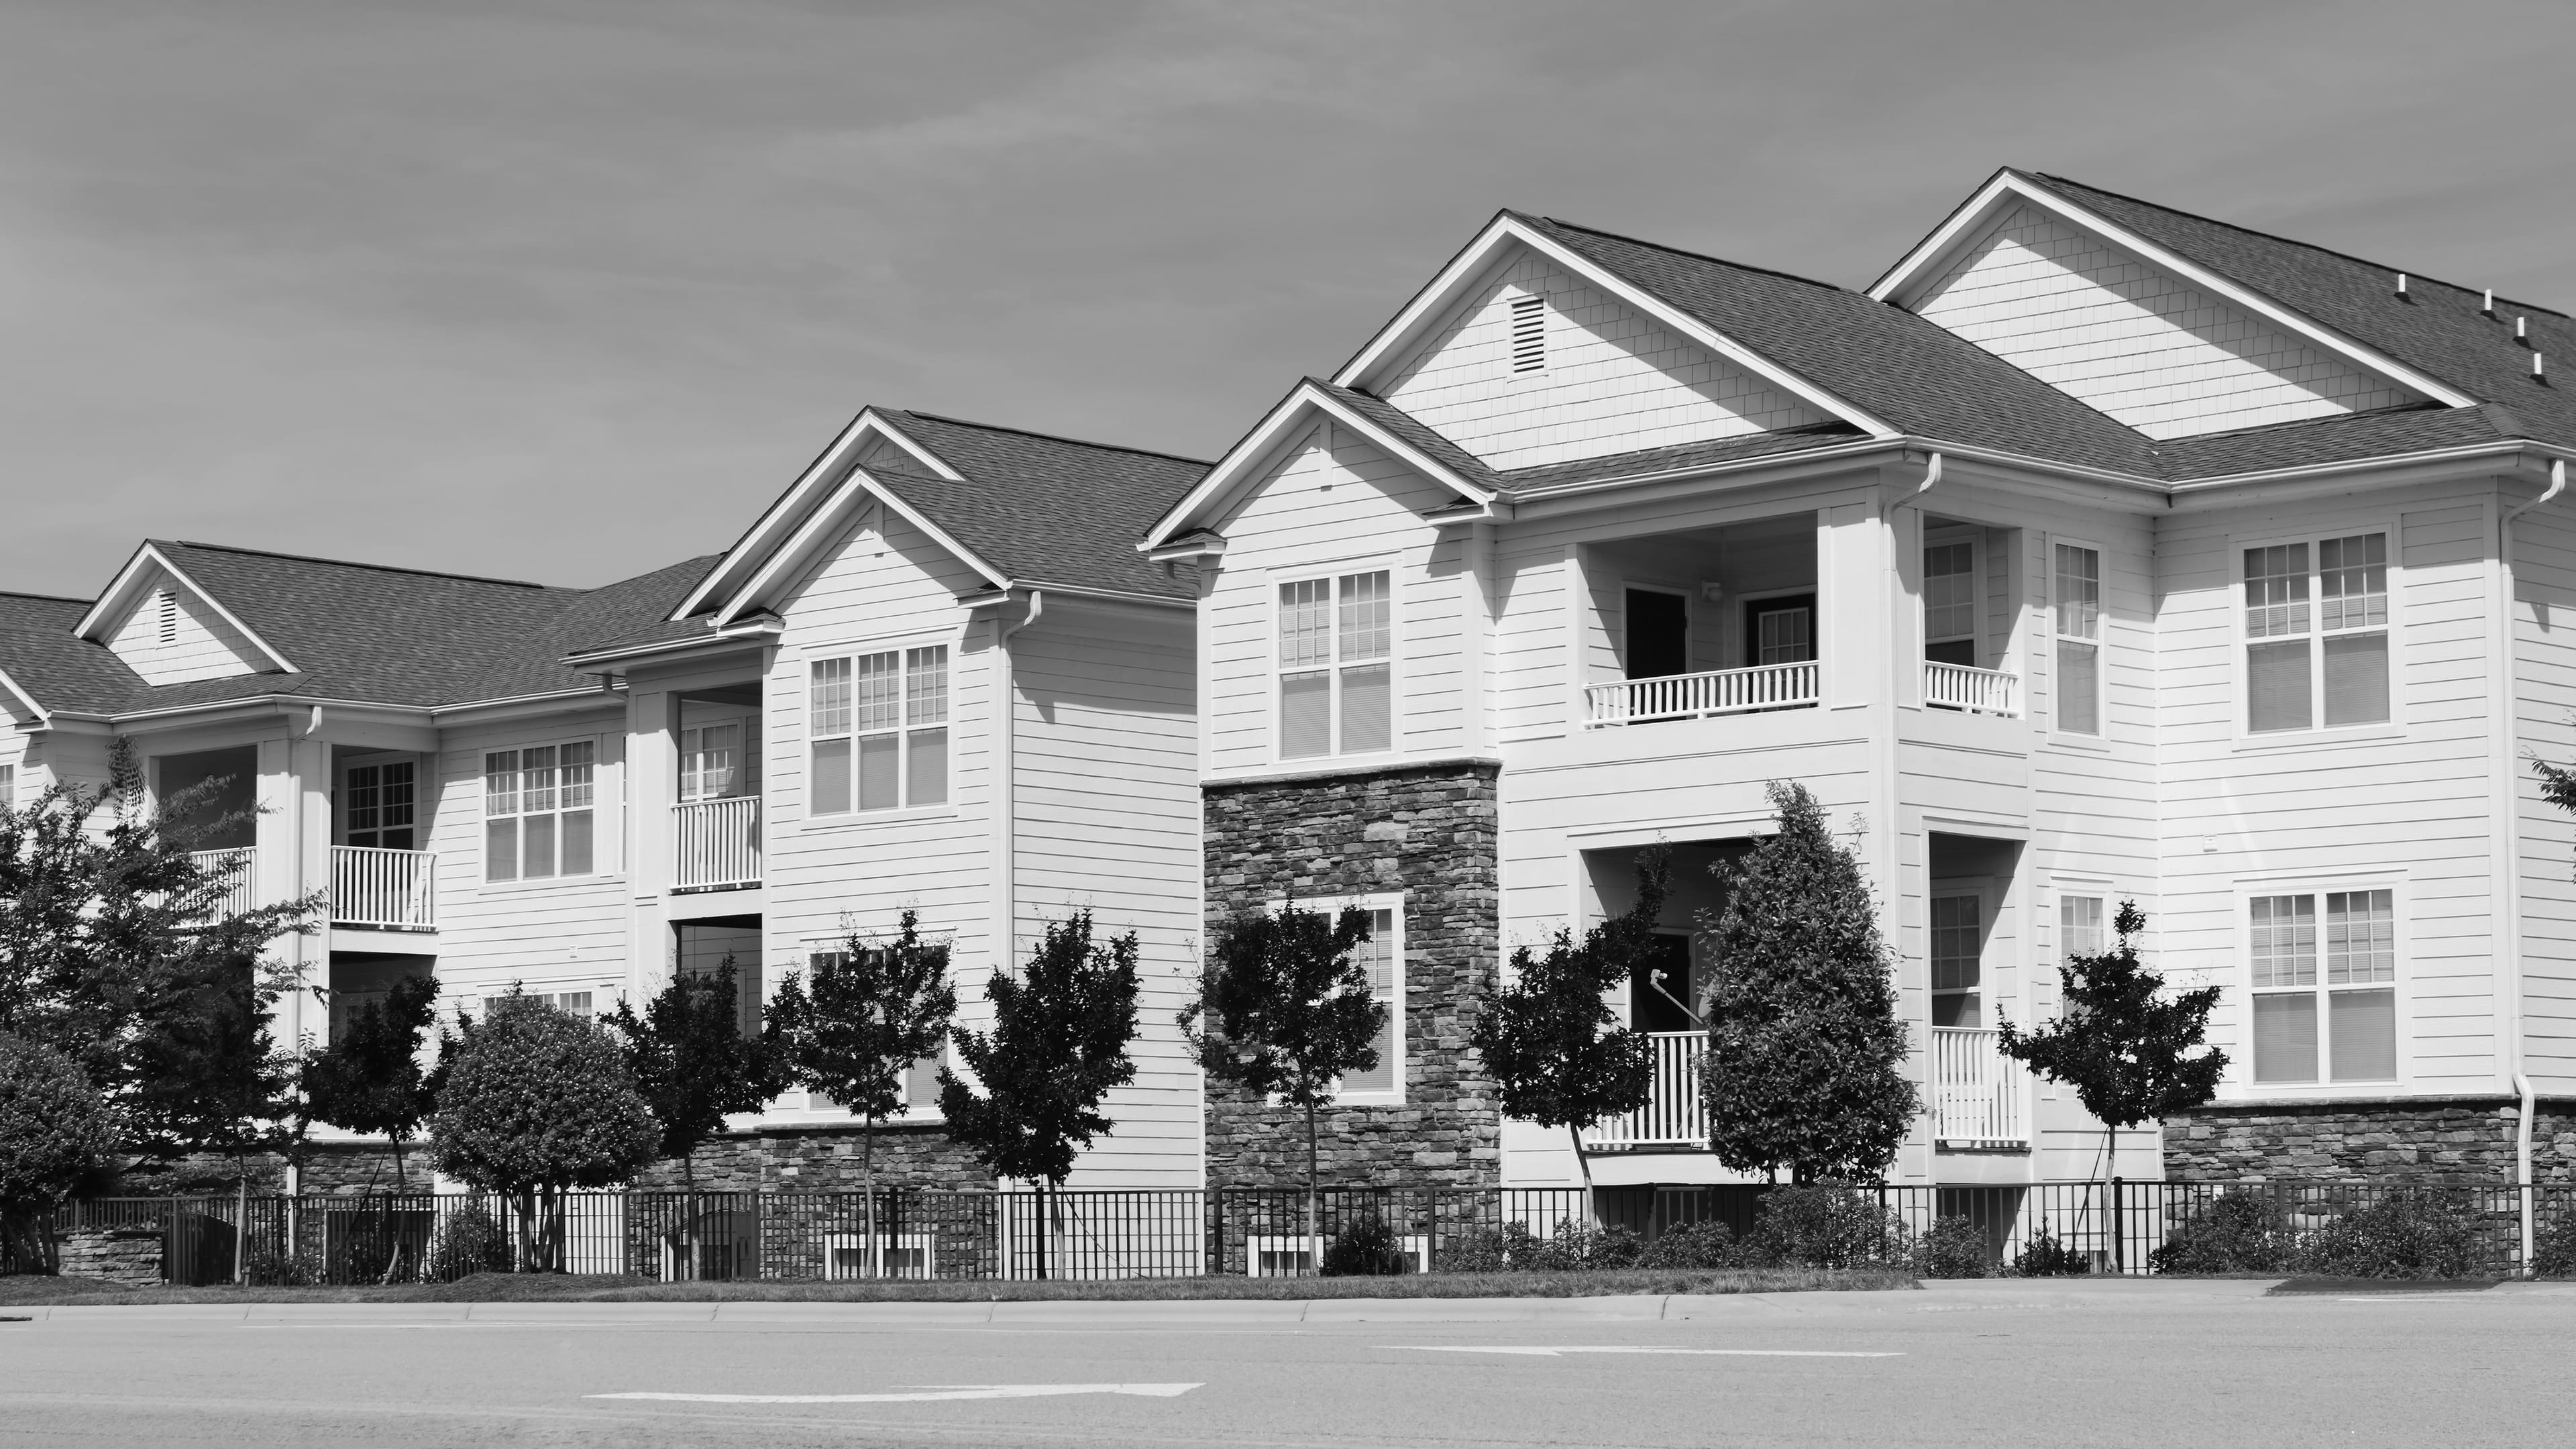
Multifamily
Videre Capital Multifamily ProgramZero percent asset management fees, as usual.
Actively Investing
| Strategies | CORE | Value-Add |
|---|---|---|
| Target Returns (gross IRR) | Coming soon | 17% levered |
| Hold Period | Coming soon | 10 years |
| Product | Coming soon | Class B and C, 1960-1990 |
| Ideal for | Coming soon | Institutions, family offices |
| Typical Deal Size | Coming soon | $10m to $30m |
Target returns are gross: after all property-level costs, and before promote. They are targets only and not a guarantee of future results.
Underwriting Built for the Real Building
Much of the distress in today’s apartment market traces back to underwriting. Many buyers in 2021 and 2022 assumed rent growth that did not arrive, budgeted renovations as though older buildings held no surprises, and financed with short-term floating-rate debt that left no room for either mistake.
We underwrite the opposite way. Income starts from trailing actual collections, not the rent roll’s best case. Leasing assumptions reflect today’s concessions and the time it really takes to fill a unit. Renovation premiums are credited only where renovated units nearby already prove them. And every acquisition carries a capital budget for the building itself, not just its interiors.
The result is a smaller set of deals that pass. That is the intended effect.

One Operating Standard, Under Videre Communities
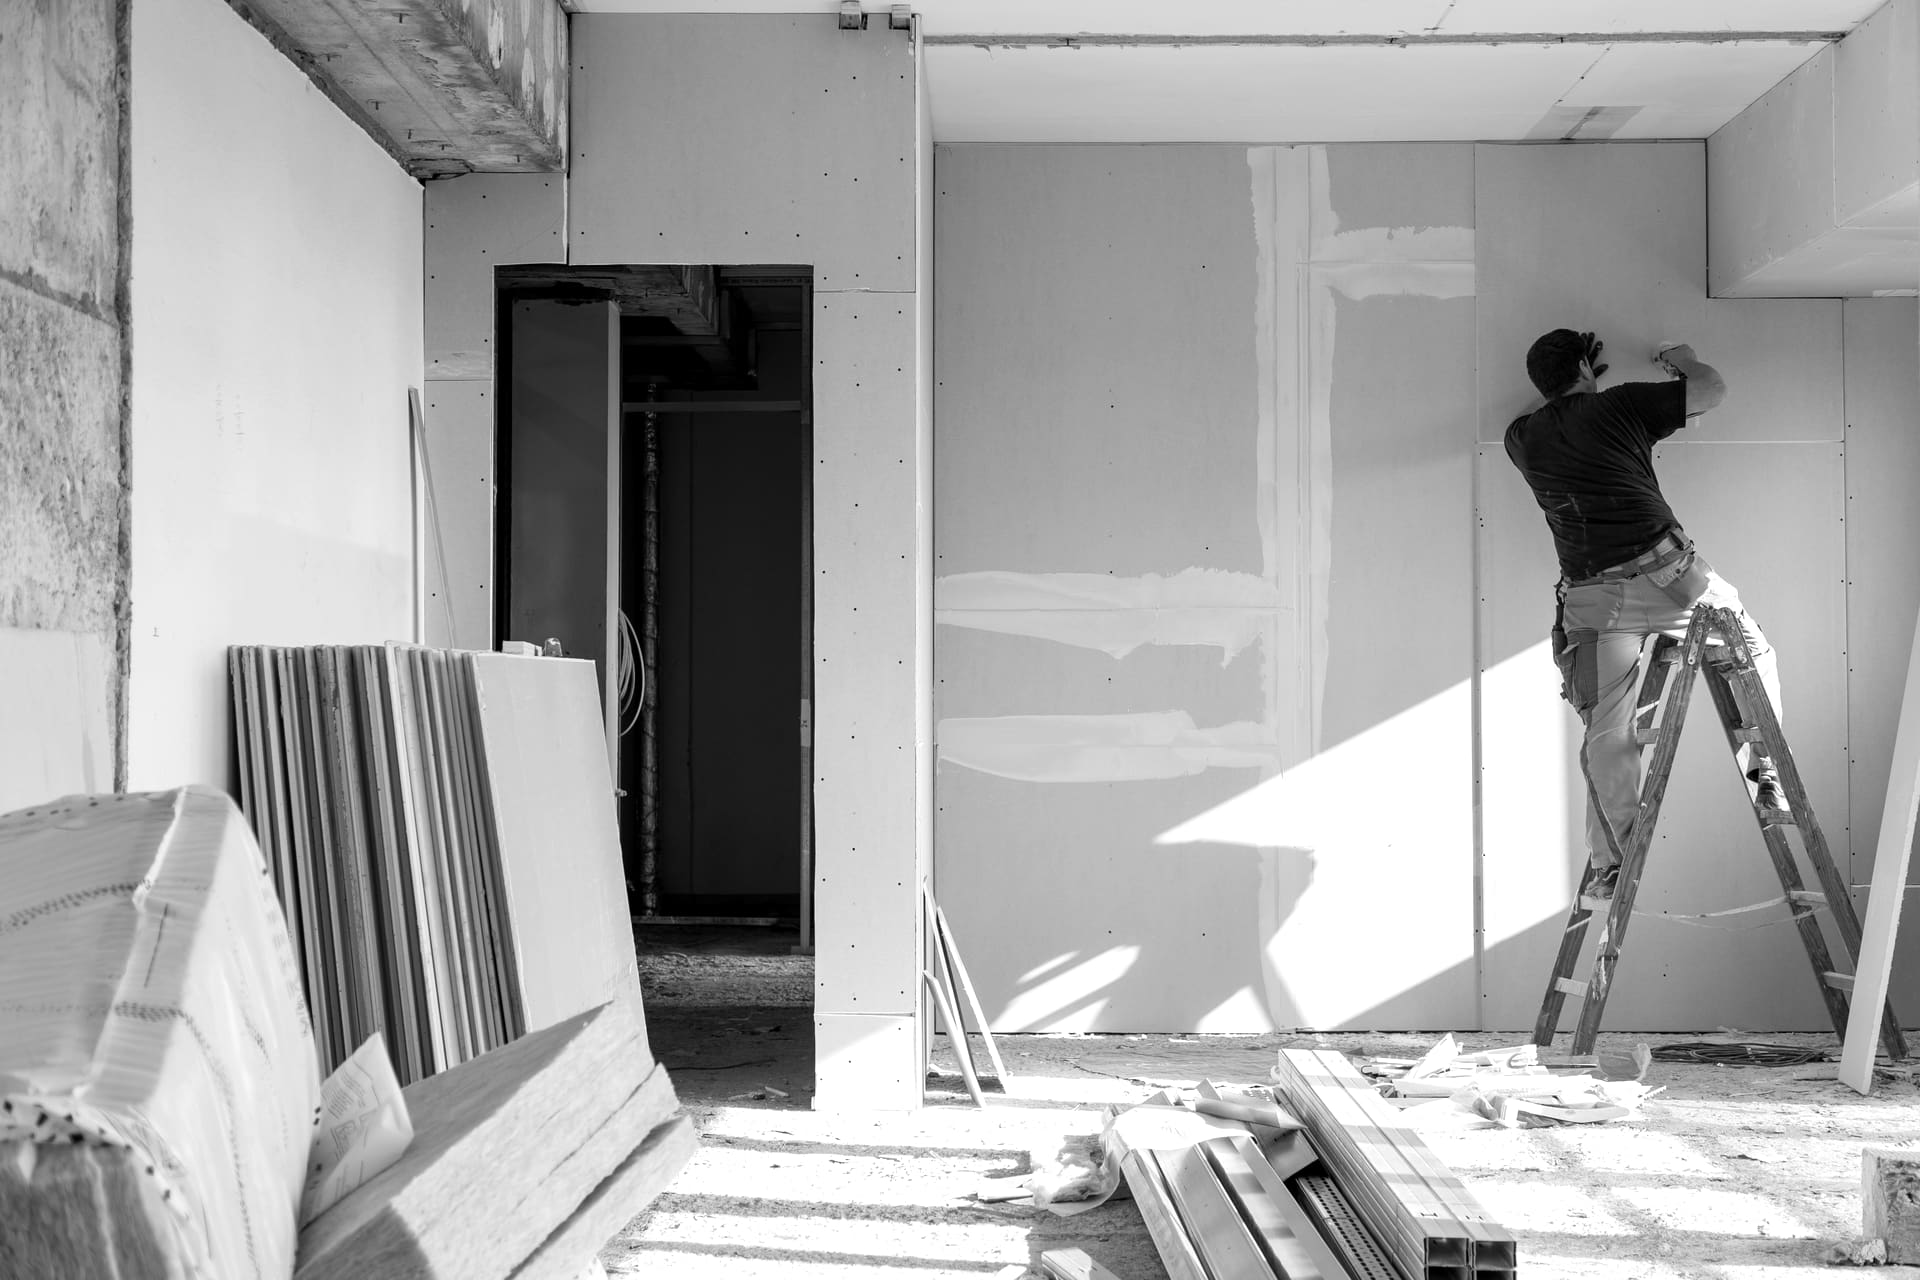
Every apartment community we acquire is managed in-house and brought under Videre Communities, the same resident-facing brand and operating standard that runs our manufactured housing communities. Residents deal with one owner, one standard of maintenance and presentation, and one team accountable for both.
Vertical integration is where much of the operating return is made. An owner that manages its own buildings controls leasing, renewals, collections, vendor pricing and unit turns directly, instead of supervising a third party paid on revenue. Our systems answer leasing inquiries at any hour, triage maintenance, flag arrears early and monitor energy and water use; people set the standard and handle everything that needs judgment.
The standard is set by what residents experience: a clean, safe, well-run community at a rent well below that of new buildings nearby. Communities run that way hold their residents, and residents who stay are the most valuable asset an apartment owner has.

Improve, Then Hold
Most of the visible work happens in the first two to three years: building systems first, then interiors as units turn, then common areas. Rents move toward the renovated market as leases roll, and operations settle into the Videre Communities standard.
After that, time does the work. Debt amortizes, renewals compound, and income grows with the market rather than with our capital. We plan ten-year holds so that no sale has to happen at a poor moment in the cycle, and so our partners capture the stabilized years, not just the renovation.
The Supply Wave Is Behind Us
The apartment market spent 2023 through 2025 absorbing a wave of new supply at a fifty-year high, concentrated in the Sun Belt. That wave has passed. Units under construction now equal 3.5% of existing inventory, the lowest share since 2013 and less than half the 7.9% peak of early 2023. Second-quarter deliveries fell 27% from a year earlier, and construction starts fell to about 55,000 units in the first quarter of 2026, the fewest since 2011 and 73% below the early 2022 peak.
Buildings that are not started cannot compete for residents. With financing and construction costs still elevated, the pipeline points to further declines through 2027, which leaves the existing stock, including the older buildings we buy, facing less new competition each year.
Early 2023, the peak
7.9%
Q2 2026
3.5%
Source: Cushman & Wakefield, U.S. Multifamily MarketBeat, Q2 2026 (Q2 2026 figures preliminary). Market estimates, not Videre results.
- Units delivered in Q2 2026, down 27% from a year earlier
88,000
Units delivered in Q2 2026, down 27% from a year earlier
- Units started in Q1 2026, the fewest in a quarter since 2011
~55,000
Units started in Q1 2026, the fewest in a quarter since 2011
- Units under construction, the lowest share of inventory since 2013
475,000
Units under construction, the lowest share of inventory since 2013
- Quarterly starts against their early 2022 peak
-73%
Quarterly starts against their early 2022 peak
Deliveries and construction: Source: Cushman & Wakefield, U.S. Multifamily MarketBeat, Q2 2026 (Q2 2026 figures preliminary). Market estimates, not Videre results. Starts: Source: CoStar, as reported by Multifamily Dive, May 2026. Market estimates, not Videre results. Fifty-year high: Source: CBRE Research, 2026 U.S. Real Estate Market Outlook, January 2026. Market estimates, not Videre results.
Demand Has Held Up
Renters kept arriving through the supply wave. Net absorption reached 124,600 units in the second quarter of 2026, the fifth-highest quarterly total in nearly 25 years and the strongest since mid-2024. Over the trailing four quarters, absorption of roughly 362,000 units exceeded new deliveries of roughly 358,000, the first time demand has outrun new supply on that measure since early 2022.
The South led, absorbing more than half of the national total in the second quarter. Dallas-Fort Worth, Phoenix, Atlanta and Austin each filled more than 13,000 units in the first half of the year.
Units, thousands. Source: Cushman & Wakefield, U.S. Multifamily MarketBeat, Q2 2026 (Q2 2026 figures preliminary). Market estimates, not Videre results.
New York
19,500
Dallas-Fort Worth
18,600
Phoenix
17,000
Atlanta
13,300
Austin
13,200
Units. Sun Belt markets in ink. Source: Cushman & Wakefield, U.S. Multifamily MarketBeat, Q2 2026 (Q2 2026 figures preliminary). Market estimates, not Videre results.
Vacancy Has Turned, Fastest Where Building Ran Hottest
Occupancy is the first thing to recover in a rental market, and it has started to. National vacancy fell 35 basis points in the second quarter to 8.9%, the first meaningful decline after more than a year in a narrow band. In the South, where most of the new supply landed, it fell to 11.0%.
The recovery is fastest in the markets that built the most. Of the 20 markets that expanded their inventory most since 2019, 18 posted a vacancy decline in the second quarter, averaging roughly 90 basis points, nearly three times the national move. Over the past year, Huntsville and Charleston each shed about four points of vacancy.
Vacancy measures differ by provider, sometimes by several points, because each counts lease-ups and property types differently. RealPage, which tracks stabilized institutional buildings, put national occupancy at 95.5% in August 2026. The level depends on the measure; the direction is what matters, and the major series now point the same way.
Occupancy: Source: RealPage, August 2026 U.S. Data Update. Market estimates, not Videre results.
- South
- United States
| Series | Q2 2025 | Q3 2025 | Q4 2025 | Q1 2026 | Q2 2026 |
|---|---|---|---|---|---|
| South | 11.4% | 11.4% | 11.5% | 11.4% | 11.0% |
| United States | 9.2% | 9.3% | 9.4% | 9.3% | 8.9% |
Overall vacancy, including buildings in lease-up. Source: Cushman & Wakefield, U.S. Multifamily MarketBeat, Q2 2026 (Q2 2026 figures preliminary). Market estimates, not Videre results.
Huntsville
-420 bps
Charleston
-400 bps
Austin
-270 bps
Raleigh
-210 bps
Jacksonville
-200 bps
Nashville
-150 bps
Atlanta
-130 bps
Phoenix
-100 bps
Orlando
-50 bps
Charlotte
-50 bps
Dallas-Fort Worth
-20 bps
United States
-30 bps
Sun Belt markets in ink, national change in grey. Source: Cushman & Wakefield, U.S. Multifamily MarketBeat, Q2 2026 (Q2 2026 figures preliminary). Market estimates, not Videre results.
Class C Has Absorbed the Pressure
The recovery is not arriving evenly. In the South, Class A rents rose 0.3% in the year to the second quarter of 2026, while Class C rents fell 4.5%, the deepest Class C cuts since the global financial crisis.
The usual explanation is a chain of concessions. New Class A buildings in lease-up offered weeks of free rent, which drew residents up from Class B; Class B cut rents to hold occupancy, and the pressure landed on Class C, whose residents have the least room in their budgets.
For a Class B and C buyer this is the most important fact in the market, and we treat it as one. We buy where the rent gap to new construction is wide enough that concessions down the street do not empty our buildings, we verify collections lease by lease before closing, and we price today’s weakness into the basis rather than underwriting a rebound.
Class A
+0.3%
Class C
-4.5%
Year ending Q2 2026. Source: RealPage, South Region Update, 2nd Quarter 2026. Market estimates, not Videre results.
Renting Is the Rational Choice, and Residents Are Staying
Homeownership has moved out of reach for a large share of renter households. Buying now costs roughly twice as much per month as renting, a 105% premium. The country is short an estimated 3.4 million single-family homes, and more than half of the $13 trillion in outstanding mortgages carry rates below 4%, which keeps existing owners from selling and starter homes off the market.
Renters are responding by staying put. Renewals now account for 57% of all leasing activity, up from 51% in 2015 and 48% in 2005. Every renewal avoids a turn, a vacancy and a concession, which makes retention one of the most valuable things an operator controls.
Renting
Index, renting = 100
100
Buying
A 105% monthly premium
205
Index derived from CBRE’s 105% buy-versus-rent premium. Source: CBRE Research, 2026 U.S. Real Estate Market Outlook, January 2026. Market estimates, not Videre results.
2005
48%
2015
51%
Latest
As of January 2026
57%
Source: CBRE Research, 2026 U.S. Real Estate Market Outlook, January 2026. Market estimates, not Videre results.
Entry Pricing Has Reset
Apartment values fell sharply as interest rates rose. As of June 2026 they stood about 19% below their 2022 peak, up just 3% over the prior year. Today’s buyer pays a basis that already reflects higher rates, rather than one set when money was nearly free.
We do not underwrite a return to peak pricing, and we do not need one. The reset matters because it lets us buy older buildings at a basis per unit and per square foot well below the cost of building new, and that gap is the margin of safety in this strategy.
- Apartment values against their 2022 peak, June 2026
-19%
Apartment values against their 2022 peak, June 2026
- Change in apartment values over the year to June 2026
+3%
Change in apartment values over the year to June 2026
Source: Green Street Commercial Property Price Index, June 2026, as reported by CRE Daily. Market estimates, not Videre results.
What Comes Next
Rental recoveries follow a sequence. Occupancy recovers first, then rents on new leases stop falling, then concessions burn off, and only then does pricing power reach renewals. Our read is that Class B in the Southeast has moved through the first two stages and is entering the third.
National asking rents grew 1.5% over the year to the second quarter of 2026, up from 1.1% in the first quarter, the first acceleration since rent growth began softening in mid-2025. CBRE projects 1.4% rent growth for 2026 and a five-year compound rate of 2.8%. Cushman & Wakefield expects vacancy to keep tightening and rent growth to strengthen over the next twelve months, with development near its cyclical trough.
The forecasts are measured, which suits a strategy that does not depend on them. We underwrite rent growth at or below them. If the recovery runs faster, our partners keep the upside; if it stalls, the plan does not depend on it.
- Stage 1 · under way
Occupancy recovers
Lease-ups fill and vacancy falls
- Stage 2 · under way
New-lease rents stop falling
Rents on new leases turn flat, then positive
- Stage 3 · entering now
Concessions burn off
Effective rents climb toward asking rents
- Stage 4
Renewal pricing broadens
Rent growth reaches every lease
Our read of Class B in the Southeast as of October 2026. A judgment, not a forecast.
| Series | Q2 2025 | Q3 2025 | Q4 2025 | Q1 2026 | Q2 2026 |
|---|---|---|---|---|---|
| United States | $1,916 | $1,906 | $1,898 | $1,921 | $1,945 |
Monthly asking rent, all classes. Rents dip seasonally in the second half of each year. Source: Cushman & Wakefield, U.S. Multifamily MarketBeat, Q2 2026 (Q2 2026 figures preliminary). Market estimates, not Videre results.
- National asking rent growth over the year to Q2 2026, up from 1.1% in Q1
1.5%
National asking rent growth over the year to Q2 2026, up from 1.1% in Q1
- Same-store effective asking rents, year over year, August 2026
+0.9%
Same-store effective asking rents, year over year, August 2026
- CBRE’s forecast for national rent growth in 2026
1.4%
CBRE’s forecast for national rent growth in 2026
- CBRE’s five-year forecast for compound annual rent growth
2.8%
CBRE’s five-year forecast for compound annual rent growth
Asking rents: Source: Cushman & Wakefield, U.S. Multifamily MarketBeat, Q2 2026 (Q2 2026 figures preliminary). Market estimates, not Videre results. Effective rents: Source: RealPage, August 2026 U.S. Data Update. Market estimates, not Videre results. Forecasts: Source: CBRE Research, U.S. Real Estate Market Outlook Midyear Review 2026. Market estimates, not Videre results.
Areas We Try to Avoid
- Heavy rehabilitation priced on the assumption that cap rates will fall.
- Short-term floating-rate bridge debt.
- Buildings whose rents sit close to new Class A, where concessions down the street empty units.
- Deferred maintenance we cannot price before closing.
- Markets with rent control or punitive landlord regulation.
- Coastal flood exposure.
- Ground-up development.