
Industrial Outdoor Storage
Videre Capital IOS ProgramZero percent asset management fees, as usual.
Actively Investing
- Target Returns
- 16% net IRR
- Hold Period
- 10 years
- AUM Target
- $150 million
- Structure
- Joint ventures with institutional and family office partners
Target returns are net of all costs and performance economics, are a target only, and are not a guarantee of future results.
The Land Is the Asset
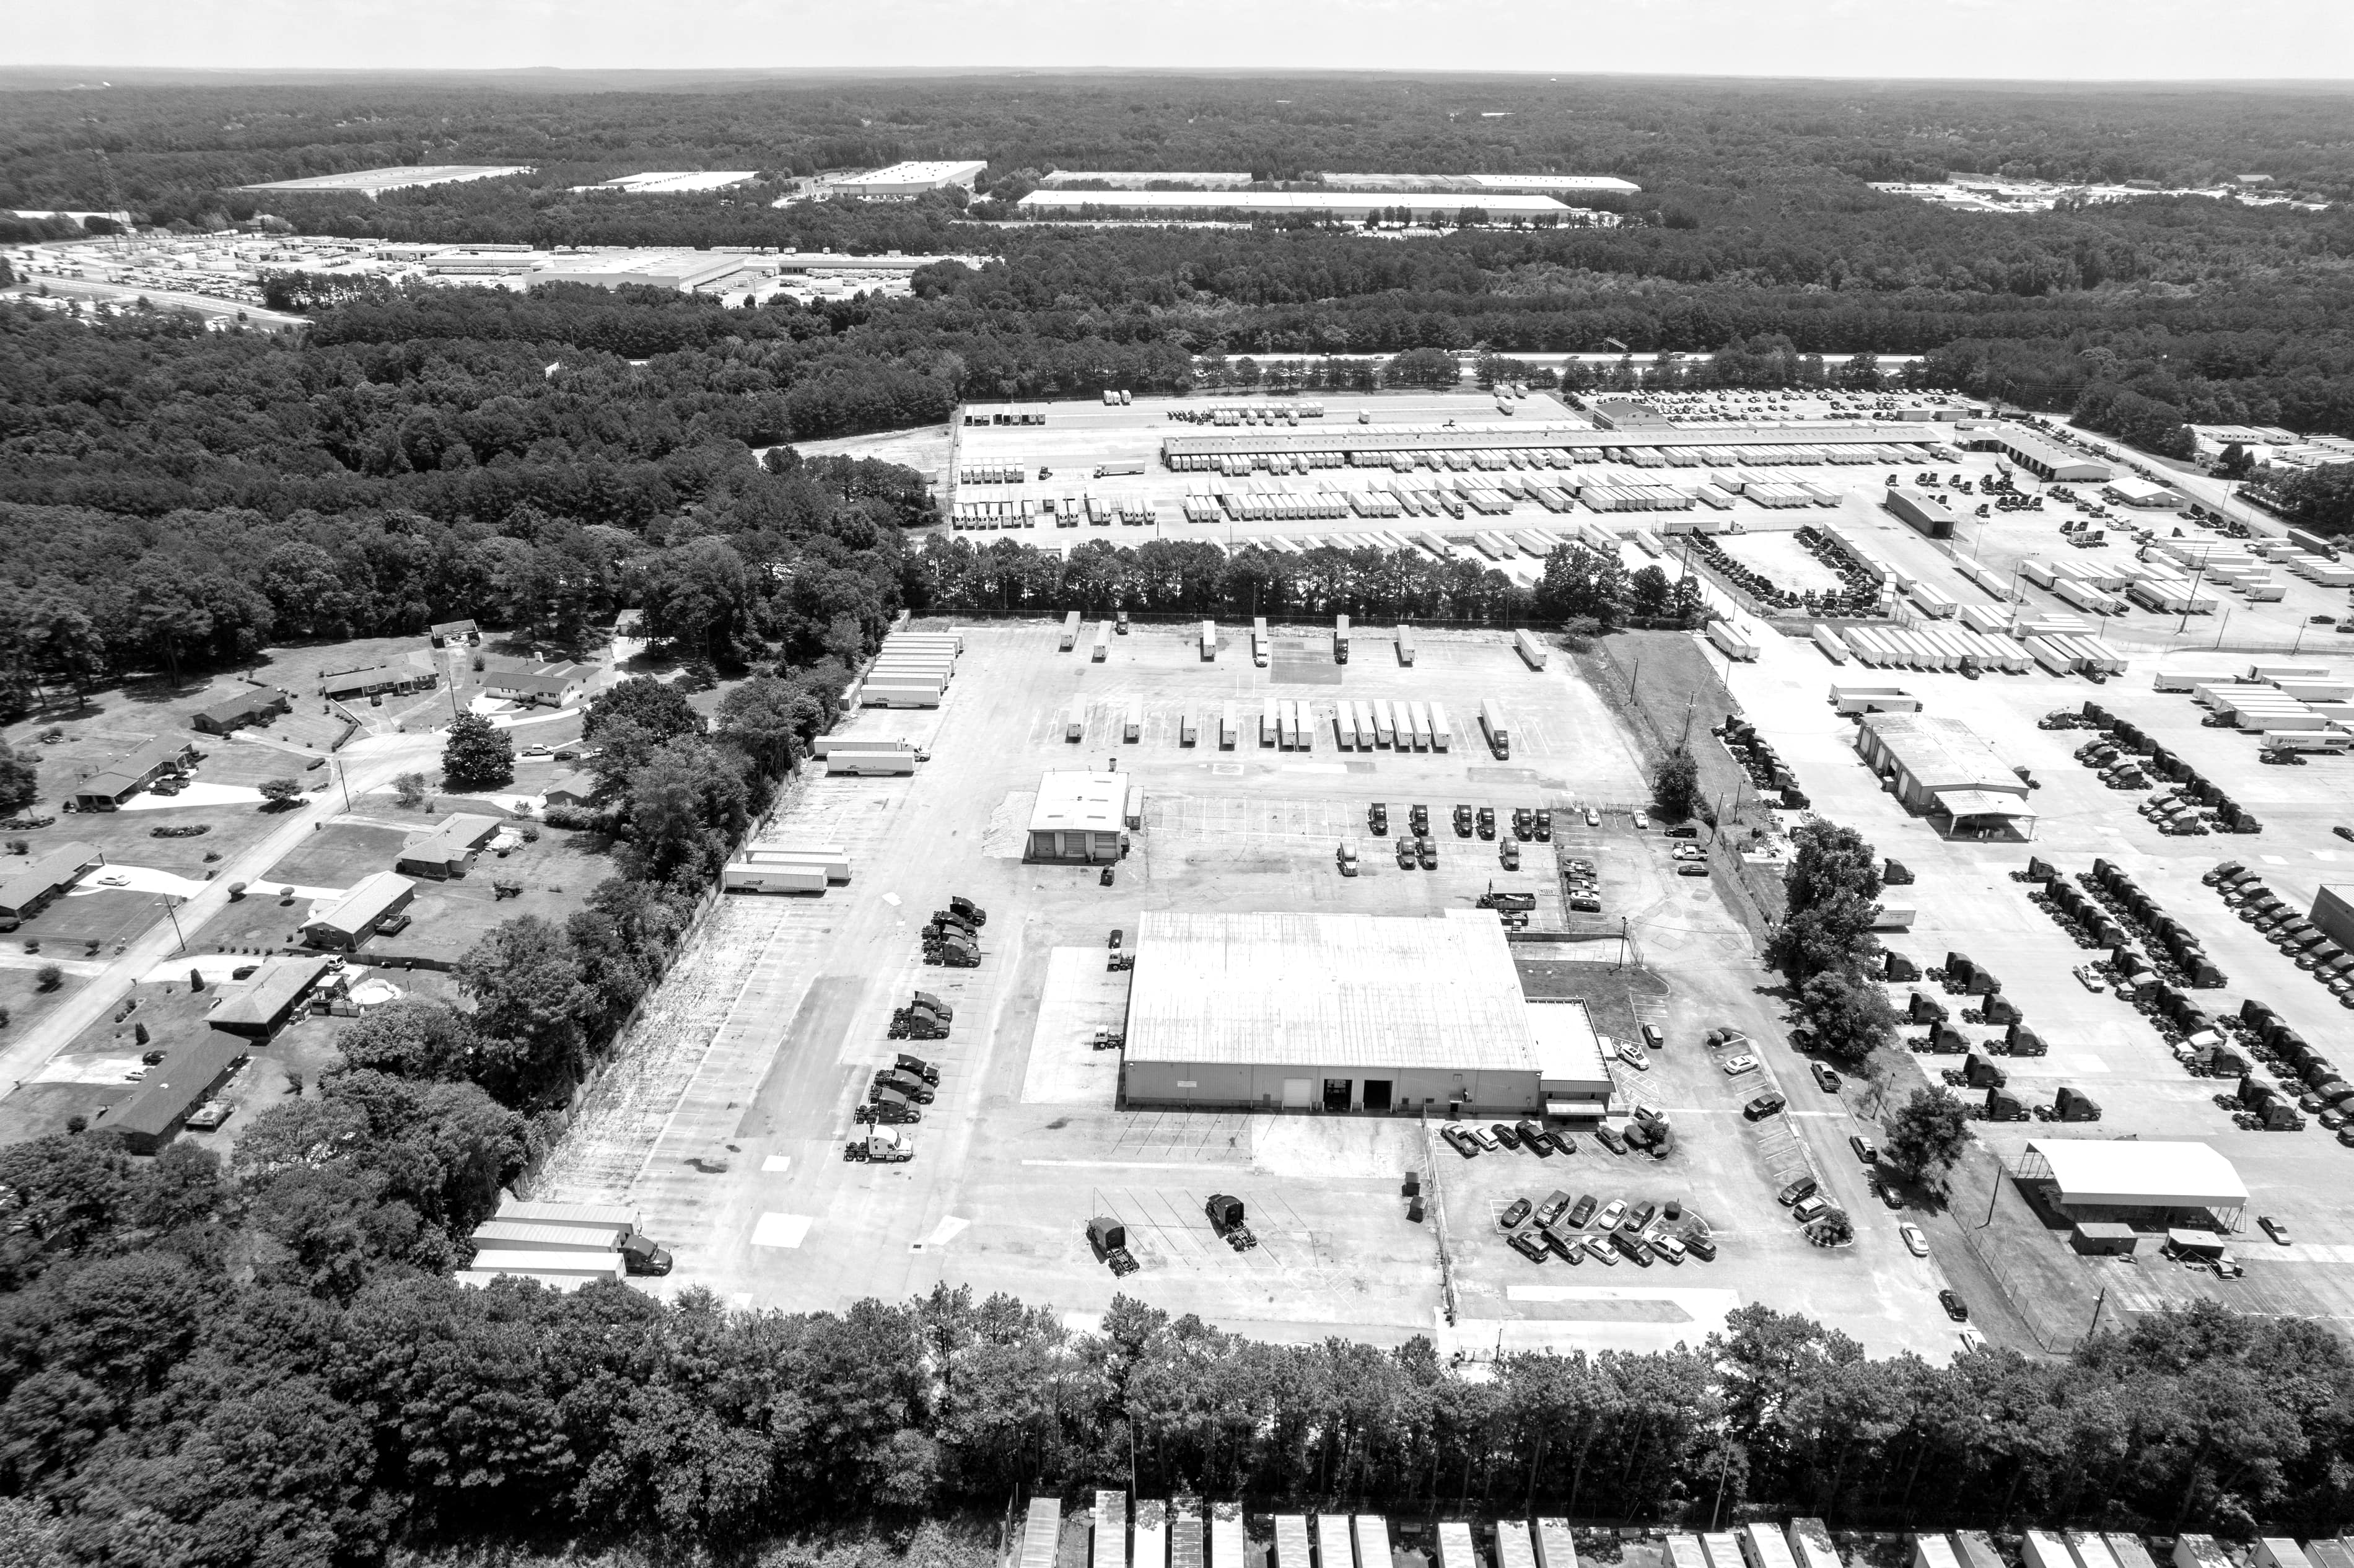
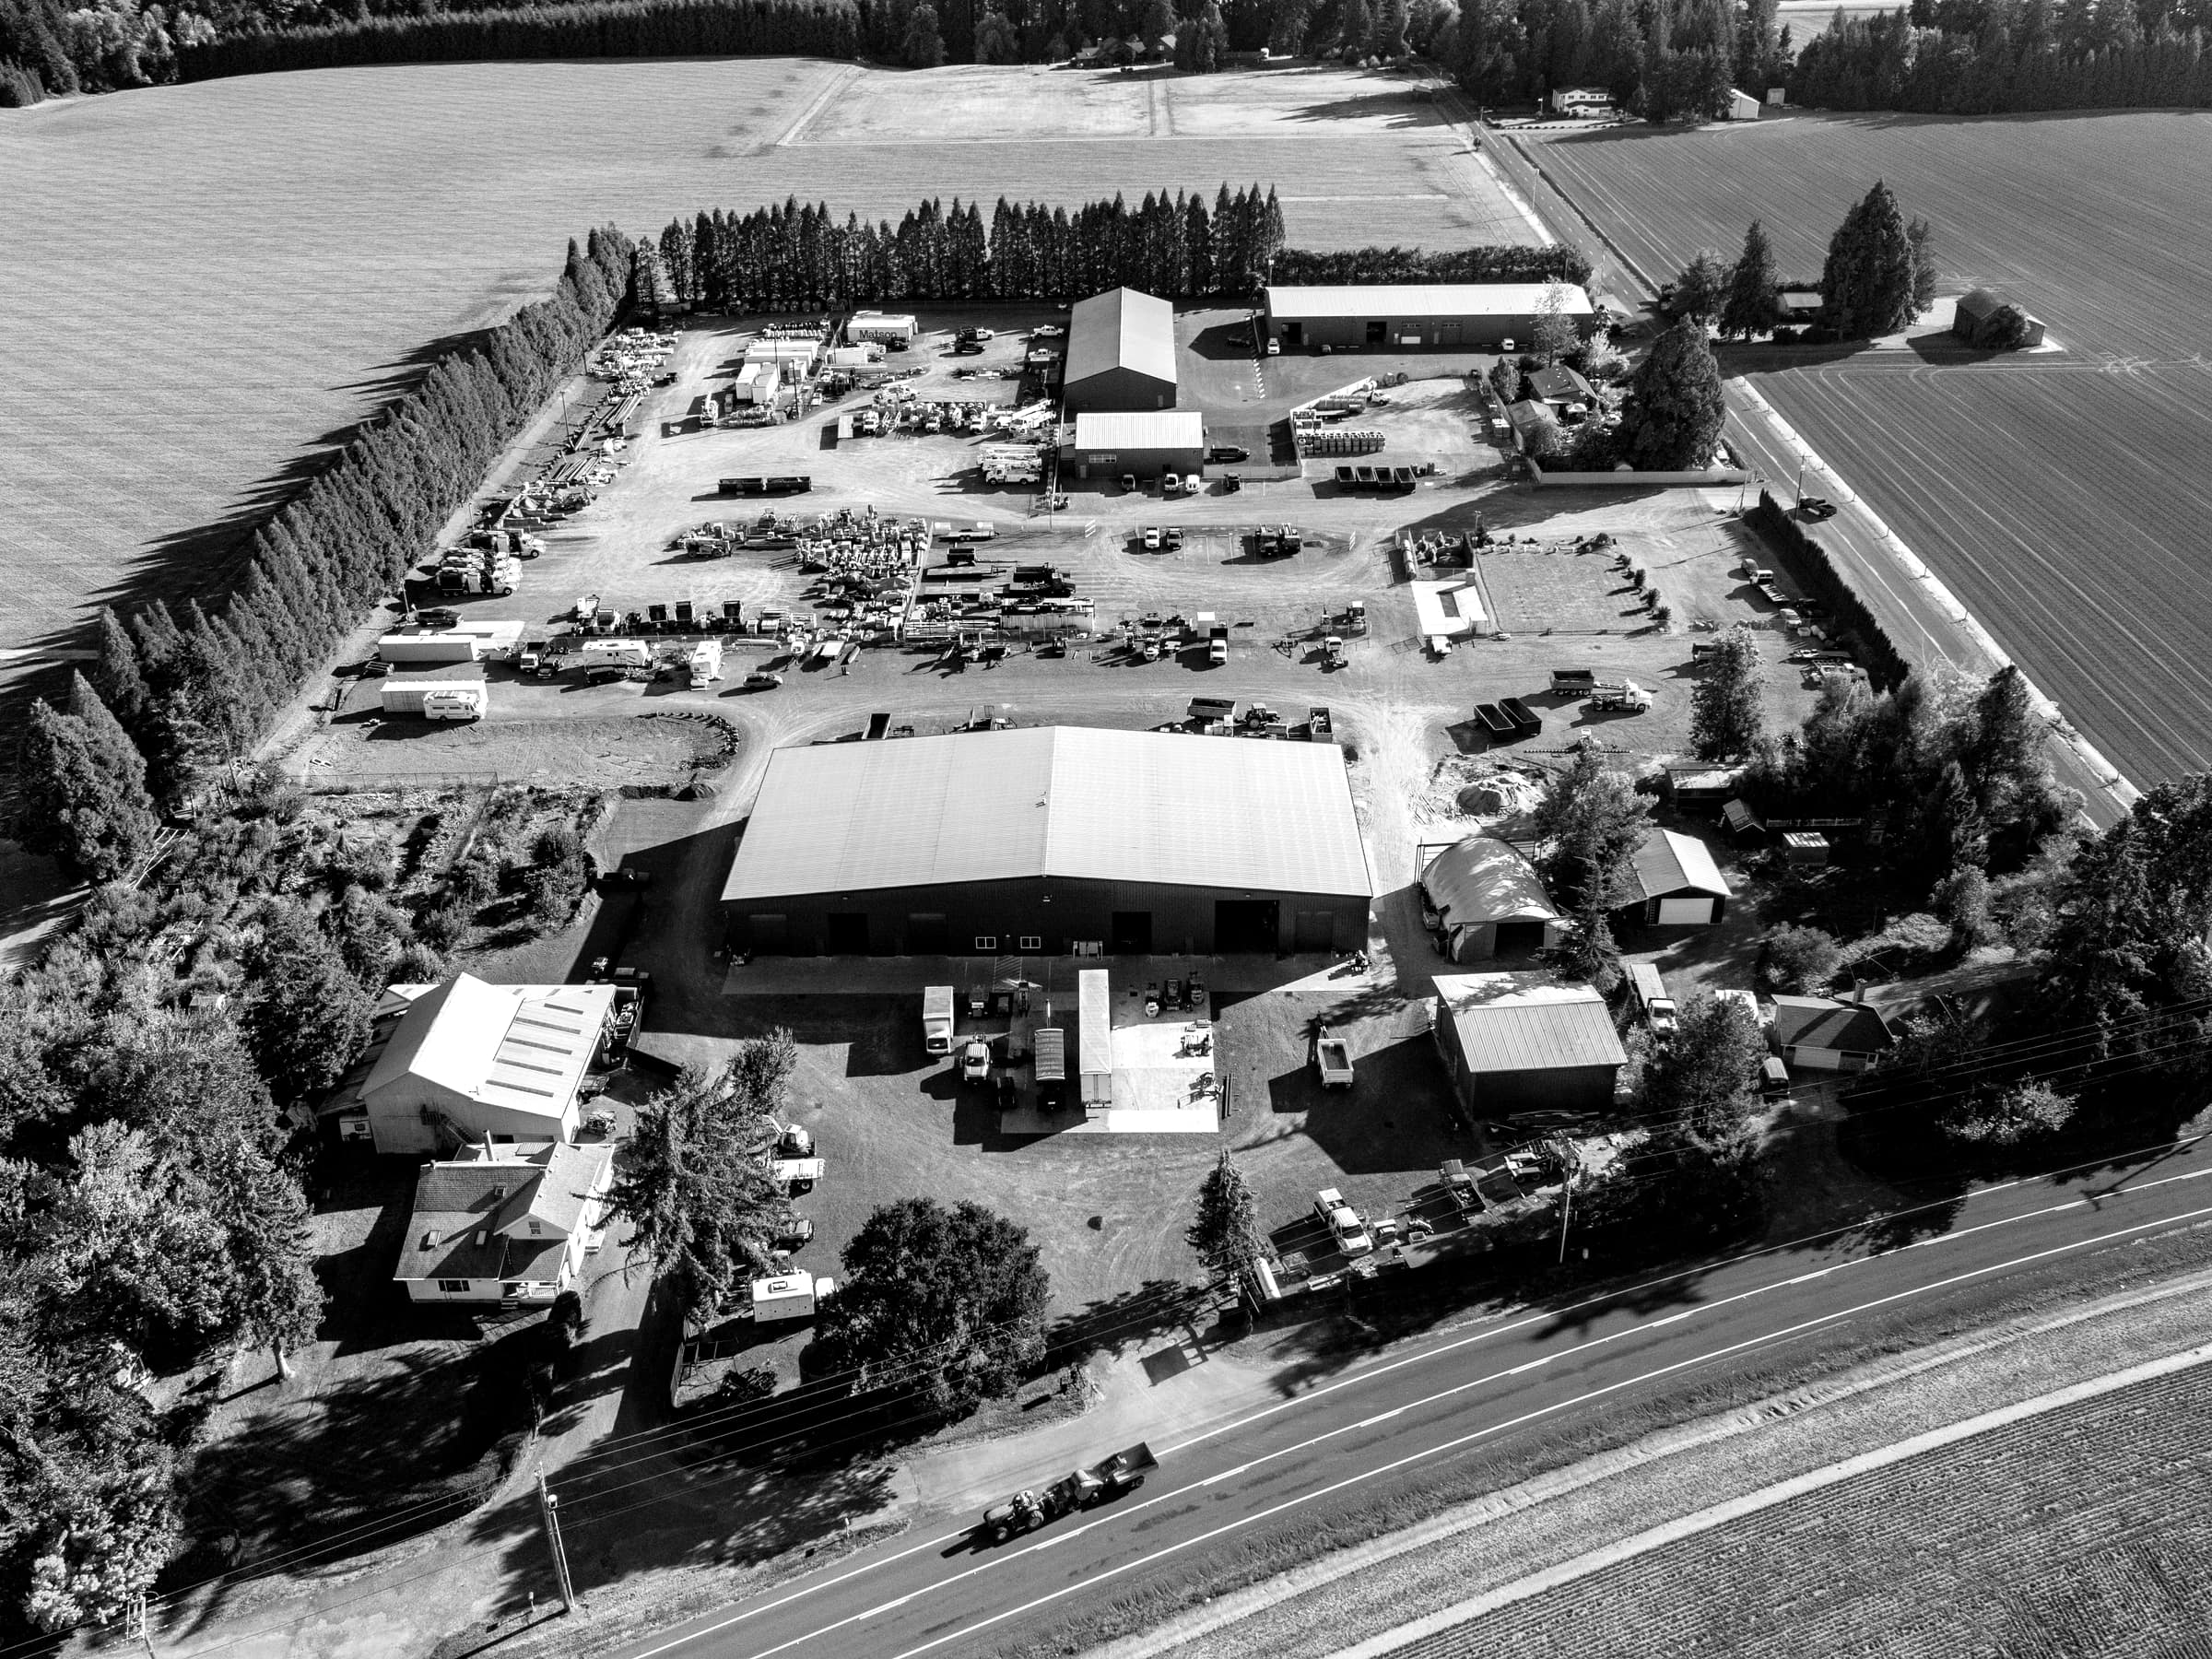
Industrial outdoor storage is a fenced, surfaced, well-located piece of industrial land with very little built on it. A small office, lighting, a gate. Tenants park trucks, trailers, containers, pipe and equipment on it. Almost none of the value sits in the improvements, which means almost none of the risk does either. There is very little to maintain and very little to replace.
A typical site runs two to ten acres with a building covering less than a fifth of it. Rent is quoted by the acre rather than the square foot, because the yard is the product and the building is an accessory to it. That single characteristic separates it from every other industrial asset class, and it is why warehouse underwriting conventions do not transfer.
An Asset Class in Early Institutionalization
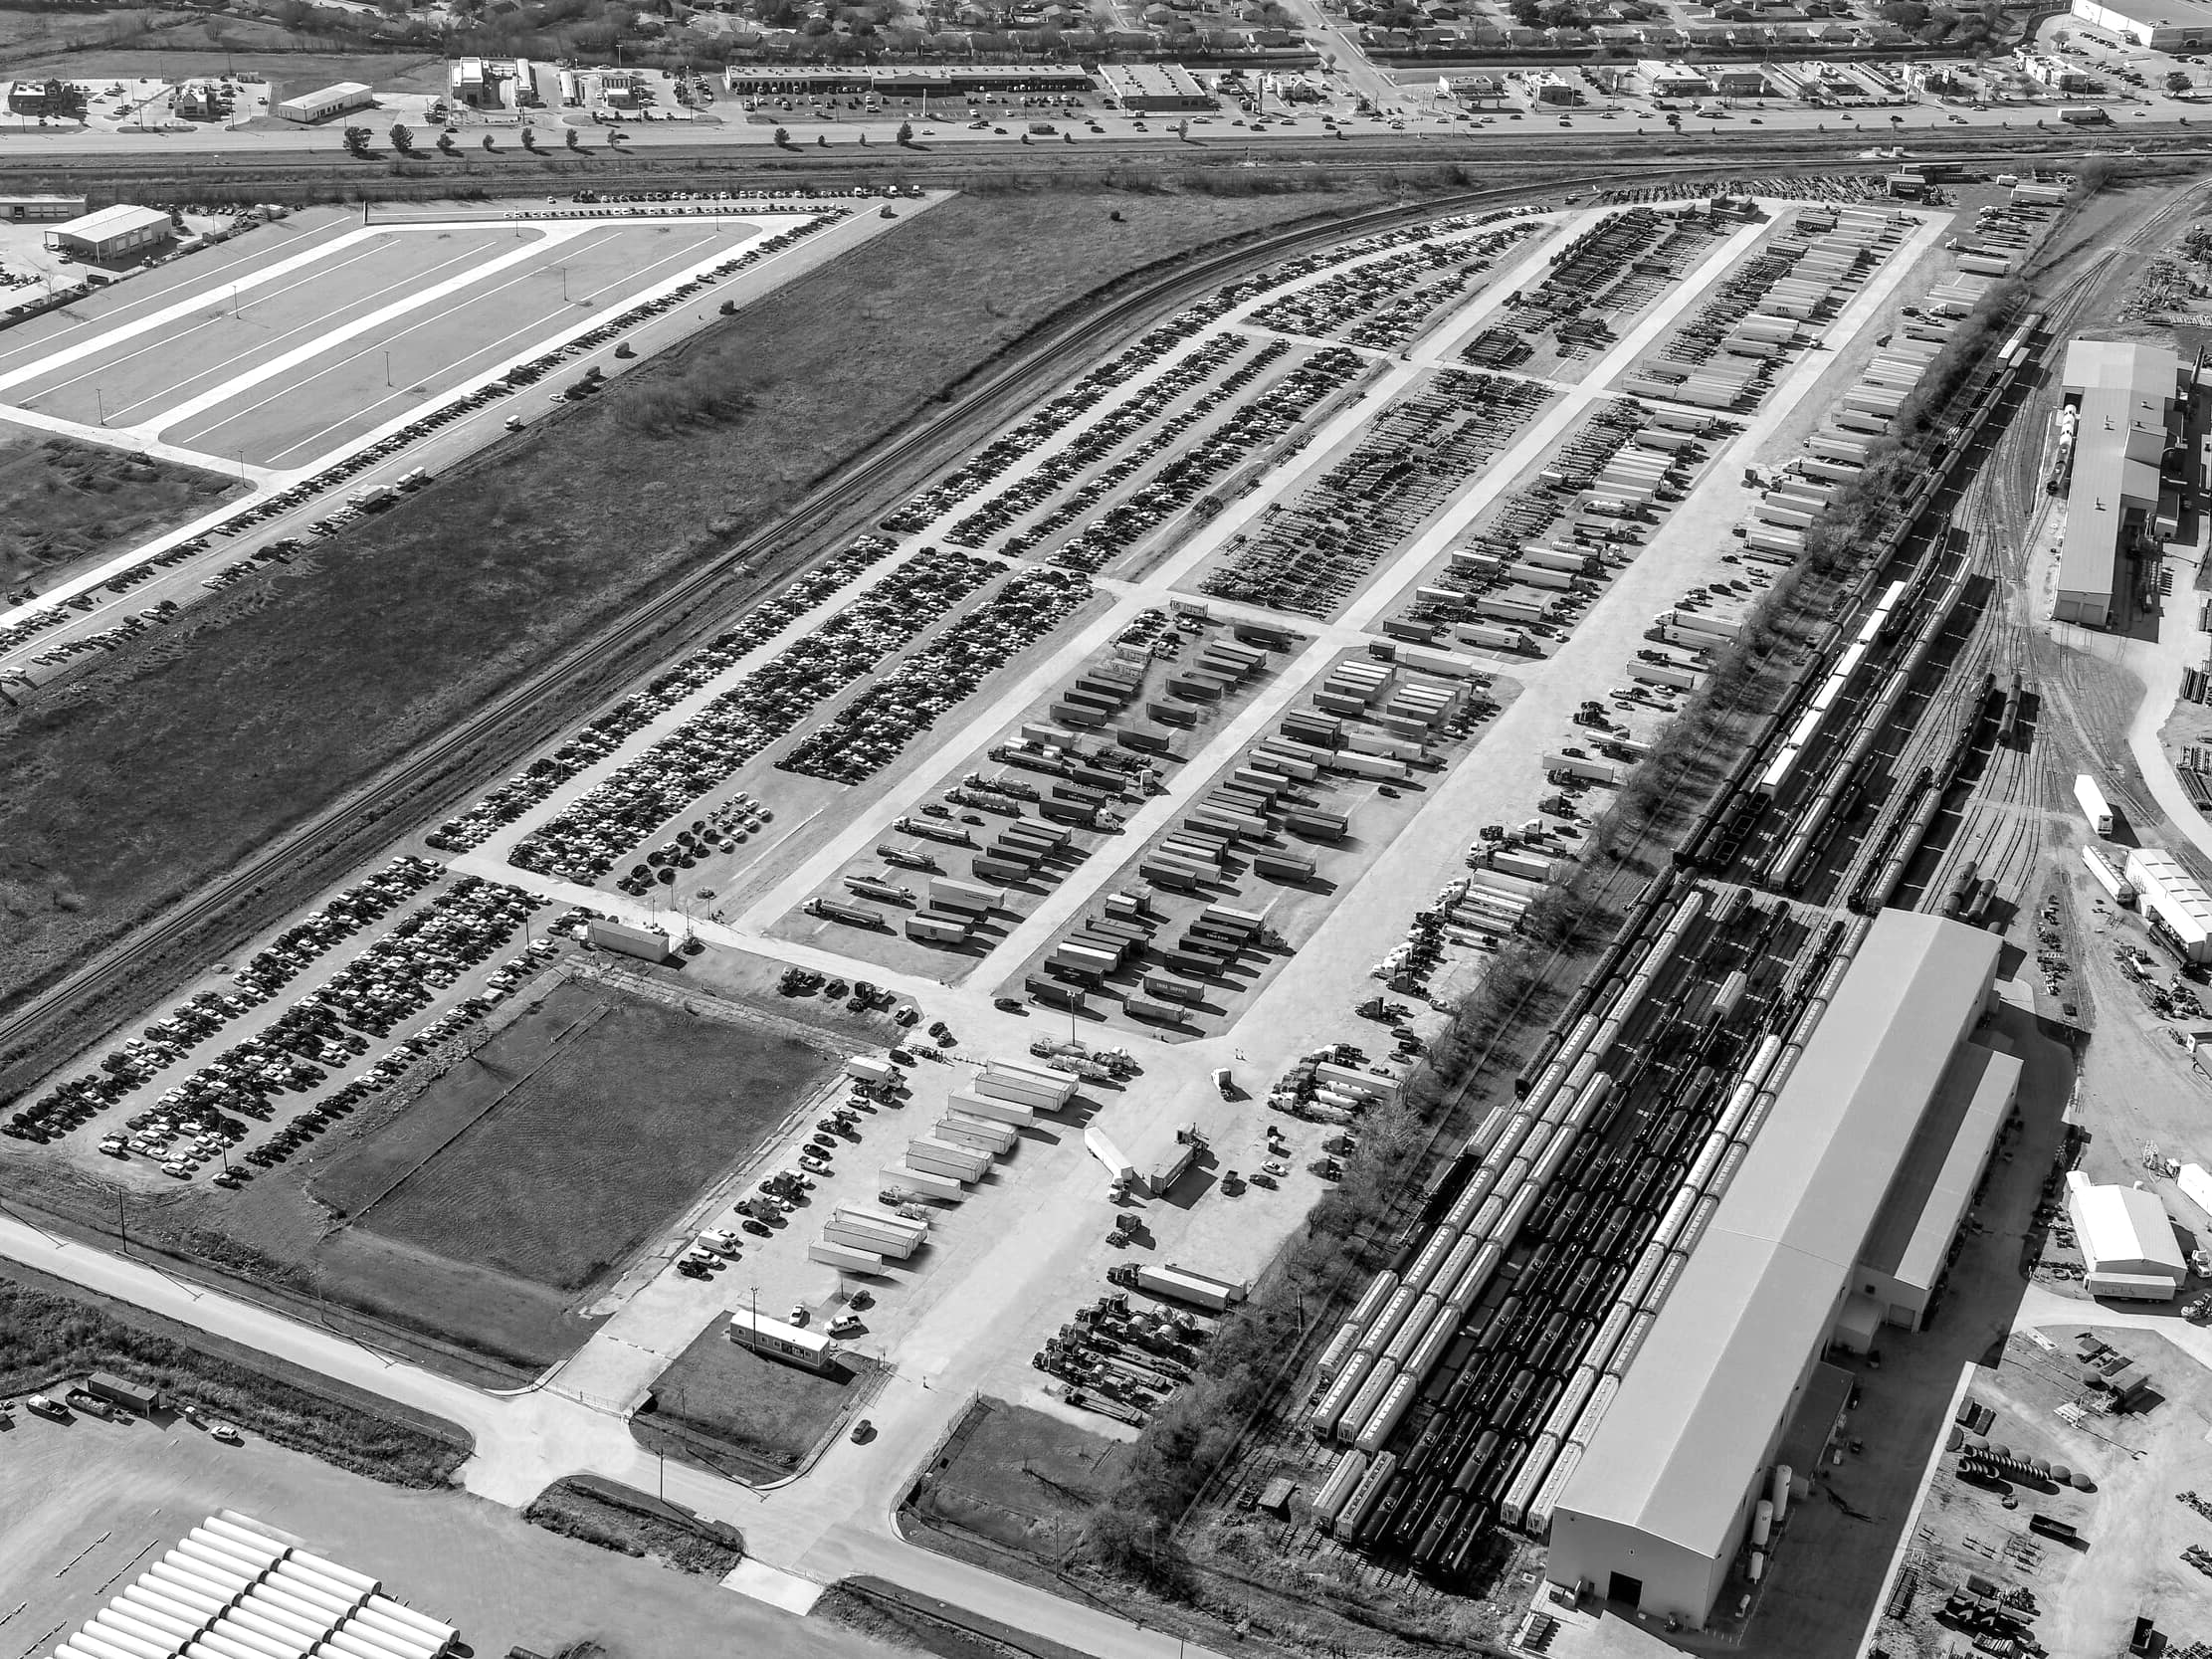
Industrial outdoor storage has only recently been treated as a distinct asset class. Ownership sits largely with the operators using the sites and with the families that sold them the underlying businesses. Institutional capital entered late and remains a minority of the sector.
- Estimated US market size in 2026, up about 9% on 2025
$218B
Estimated US market size in 2026, up about 9% on 2025
- Estimated transaction volume in 2025, 15% to 20% above 2024
$14 to 16B
Estimated transaction volume in 2025, 15% to 20% above 2024
- Share of acquisitions now driven by institutional capital, against 25% to 30% four years ago
35 to 45%
Share of acquisitions now driven by institutional capital, against 25% to 30% four years ago
- Still owned by private operators and long-term owner-users
65 to 75%
Still owned by private operators and long-term owner-users
Source: Matthews Real Estate Investment Services, 2026 IOS Sector Update, March 2026. Market estimates, not Videre results.
Rent Is a Marginal Line in the Tenant’s Cost Base
The case for this asset class rests on the composition of the tenant’s cost base rather than on real estate fundamentals alone. Decomposed, a distributor’s logistics budget is dominated by transportation, and fixed facility cost, the rent line, is the smallest component within it.
That asymmetry underpins the thesis. A site that shortens routes recovers its cost many times over in fuel, labor hours and fleet utilization, and the rent required to capture that saving is immaterial against the saving itself. One published estimate frames the relationship at approximately eight to one: an 8% increase in fixed facility cost carries roughly the same effect as a 1% increase in transportation cost.
A tenant will negotiate a rent increase and still accept it, because relocating to a cheaper site costs more than remaining. We underwrite to that relationship rather than to a comparable rent analysis.
Transportation
45% to 70%
Variable facility cost
including payroll
15% to 25%
Inventory carrying
12% to 16%
Other
7% to 12%
Fixed facility cost
the rent line
3% to 6%
Share of total logistics cost. Source: CBRE, Supply Chain Disruptions Create New Opportunities for Industrial and Logistics Real Estate, December 2021. Bands are estimates and do not sum to 100%.
Entitled Supply Is Being Withdrawn, Not Replaced
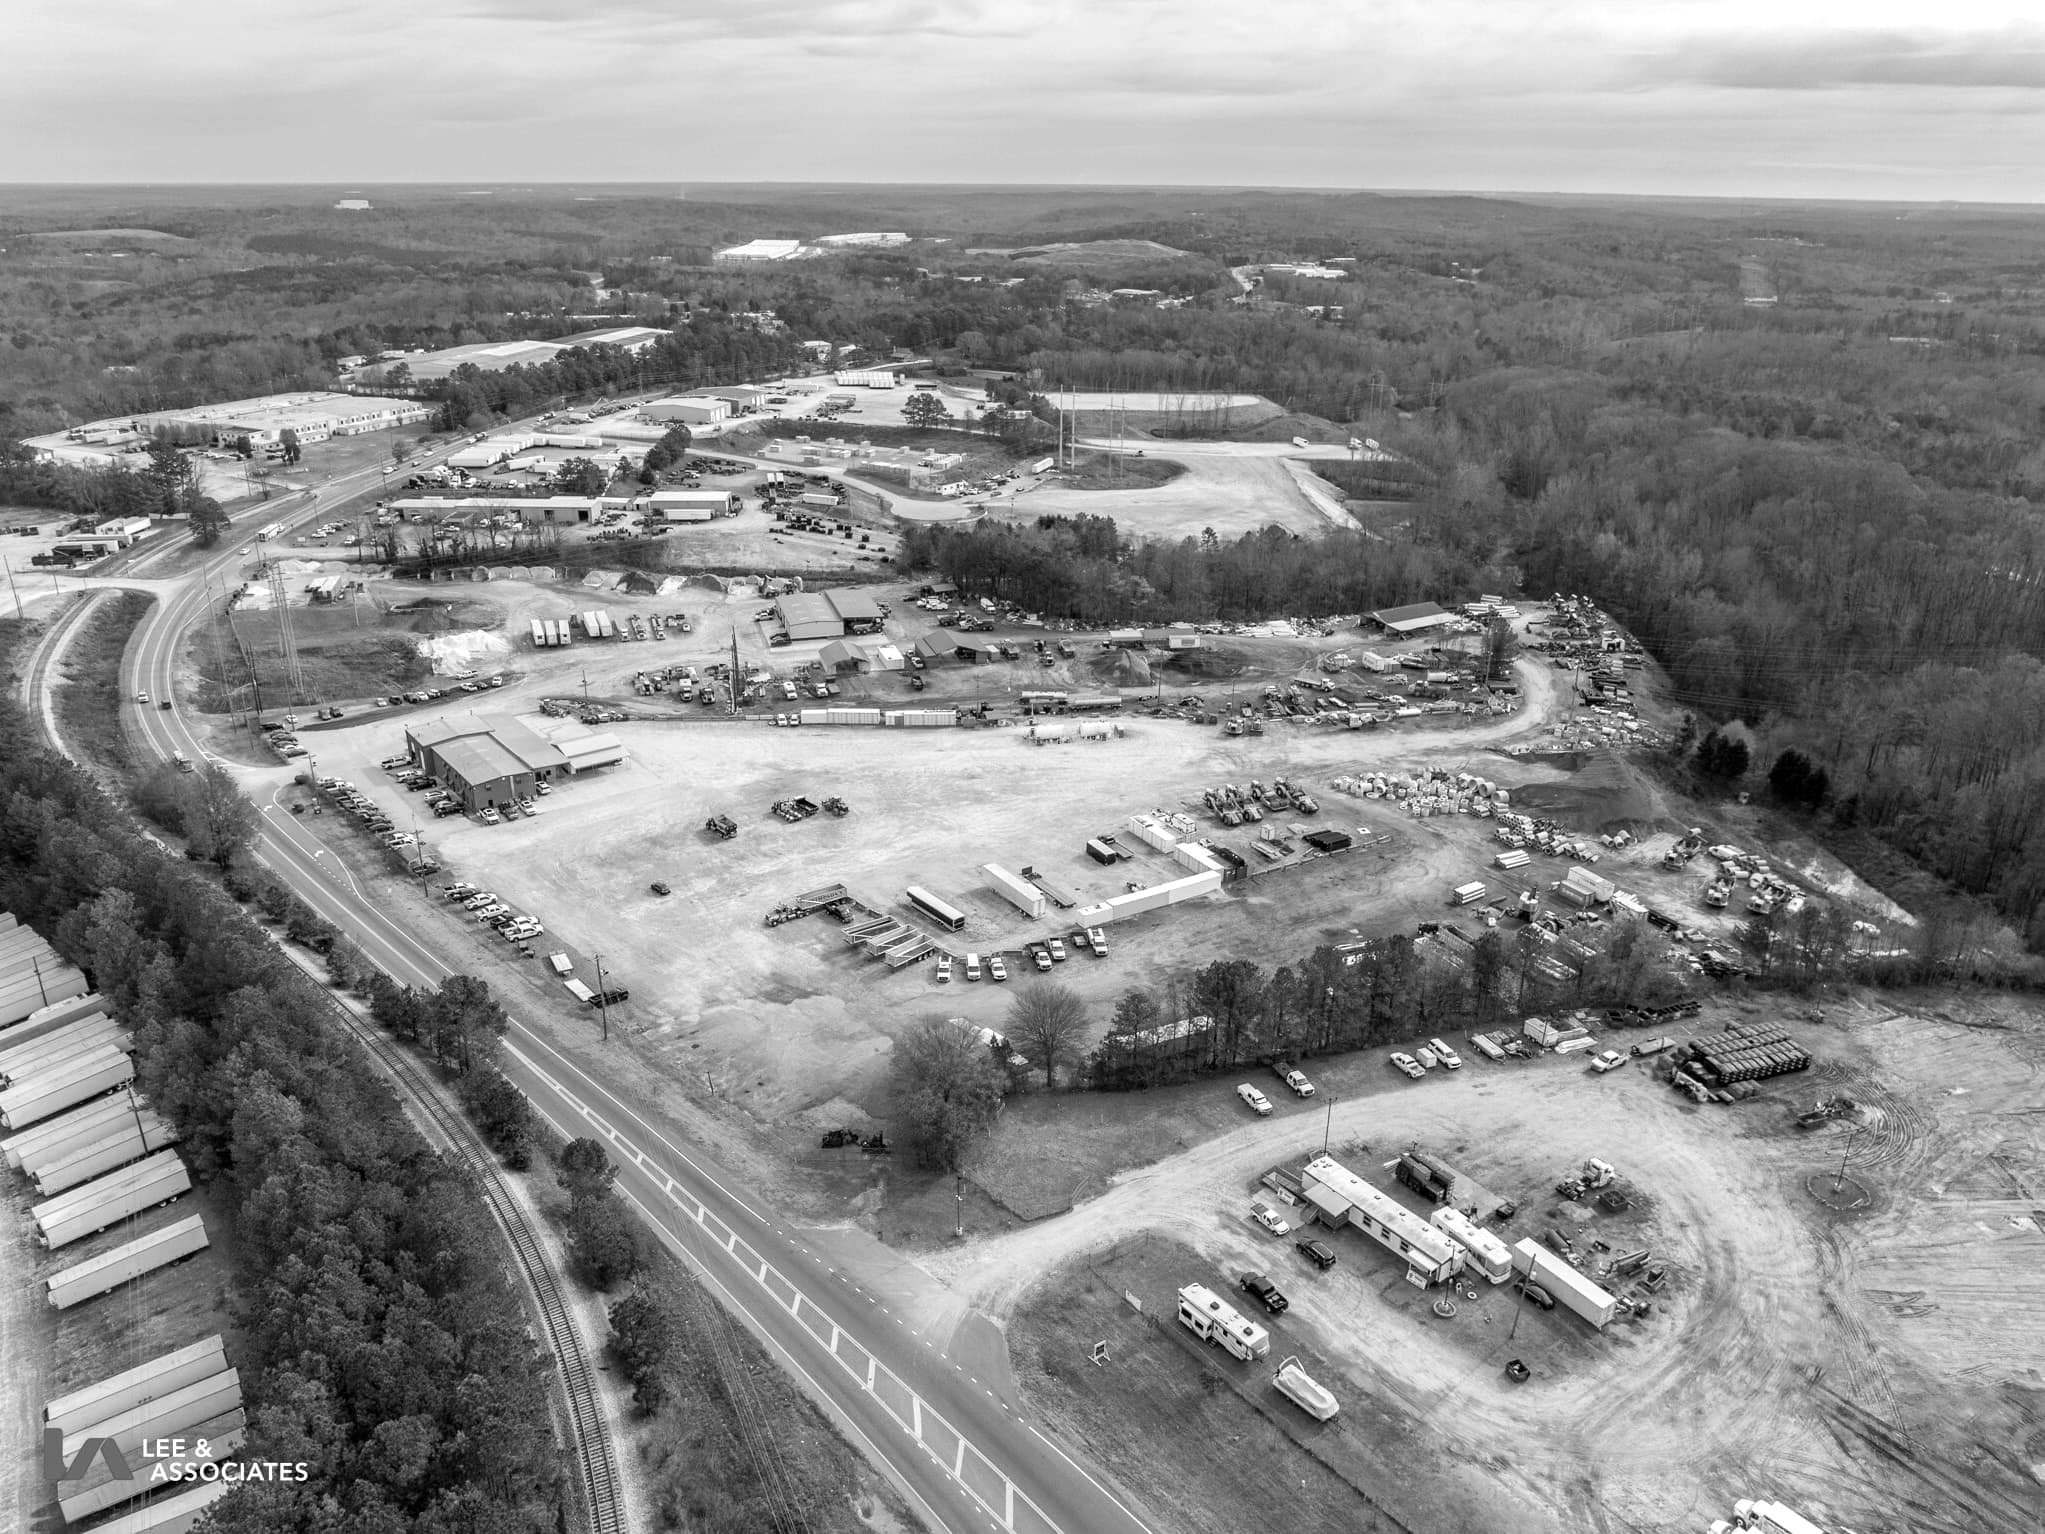
The land that works for this use is industrial land near a freight corridor and close to the city it serves. Municipalities have spent twenty years converting exactly that land into warehouses, apartments and retail, and almost none of them are zoning more of it. Supply is not merely constrained; it is being withdrawn while demand for logistics space continues to rise.
The underlying figures are unambiguous. New deliveries run at under 2% of inventory a year. In many large metros somewhere between 30% and 50% of industrial-zoned land blocks this use by right, and getting an entitlement takes nine to eighteen months, longer in the strict jurisdictions. A yard generates the highest truck traffic and the lowest tax yield of any industrial use, which leaves municipalities with little incentive to approve one.
Around 60% of what exists was built before 2000, much of it unpaved. As tenants increasingly require stabilized surfacing, drainage, lighting and secure perimeters, that older inventory ceases to compete until capital is applied. That is the work this strategy underwrites.
The Fundamentals
Three conditions must hold for the strategy to work: entry yields above traditional industrial, sustained occupancy, and rent growth. All three currently hold, and the first is narrowing as capital enters the sector.
Primary markets
6% to 6.75%
Secondary markets
6.75% to 7.75%
IOS cap rates sit roughly 25 to 75 basis points above comparable industrial, after 25 to 50 basis points of compression in top markets over the past year. Source: Matthews Real Estate Investment Services, 2026 IOS Sector Update, March 2026. Market estimates, not Videre results.
Primary markets
4% to 6%
Secondary markets
6% to 8%
Improved top-metro sites
paved and secured
0% to 4%
Source: Matthews Real Estate Investment Services, 2026 IOS Sector Update, March 2026. Market estimates, not Videre results.
IOS, 2024
8% to 10%
IOS, 2025
7% to 9%
IOS, 2026 projected
6% to 8%
Warehouse, current
3% to 5%
A three-year compound rate of roughly 8% to 9% against a moderating warehouse market. Source: Matthews Real Estate Investment Services, 2026 IOS Sector Update, March 2026. Market estimates, not Videre results.
Tenants Who Cannot Easily Leave
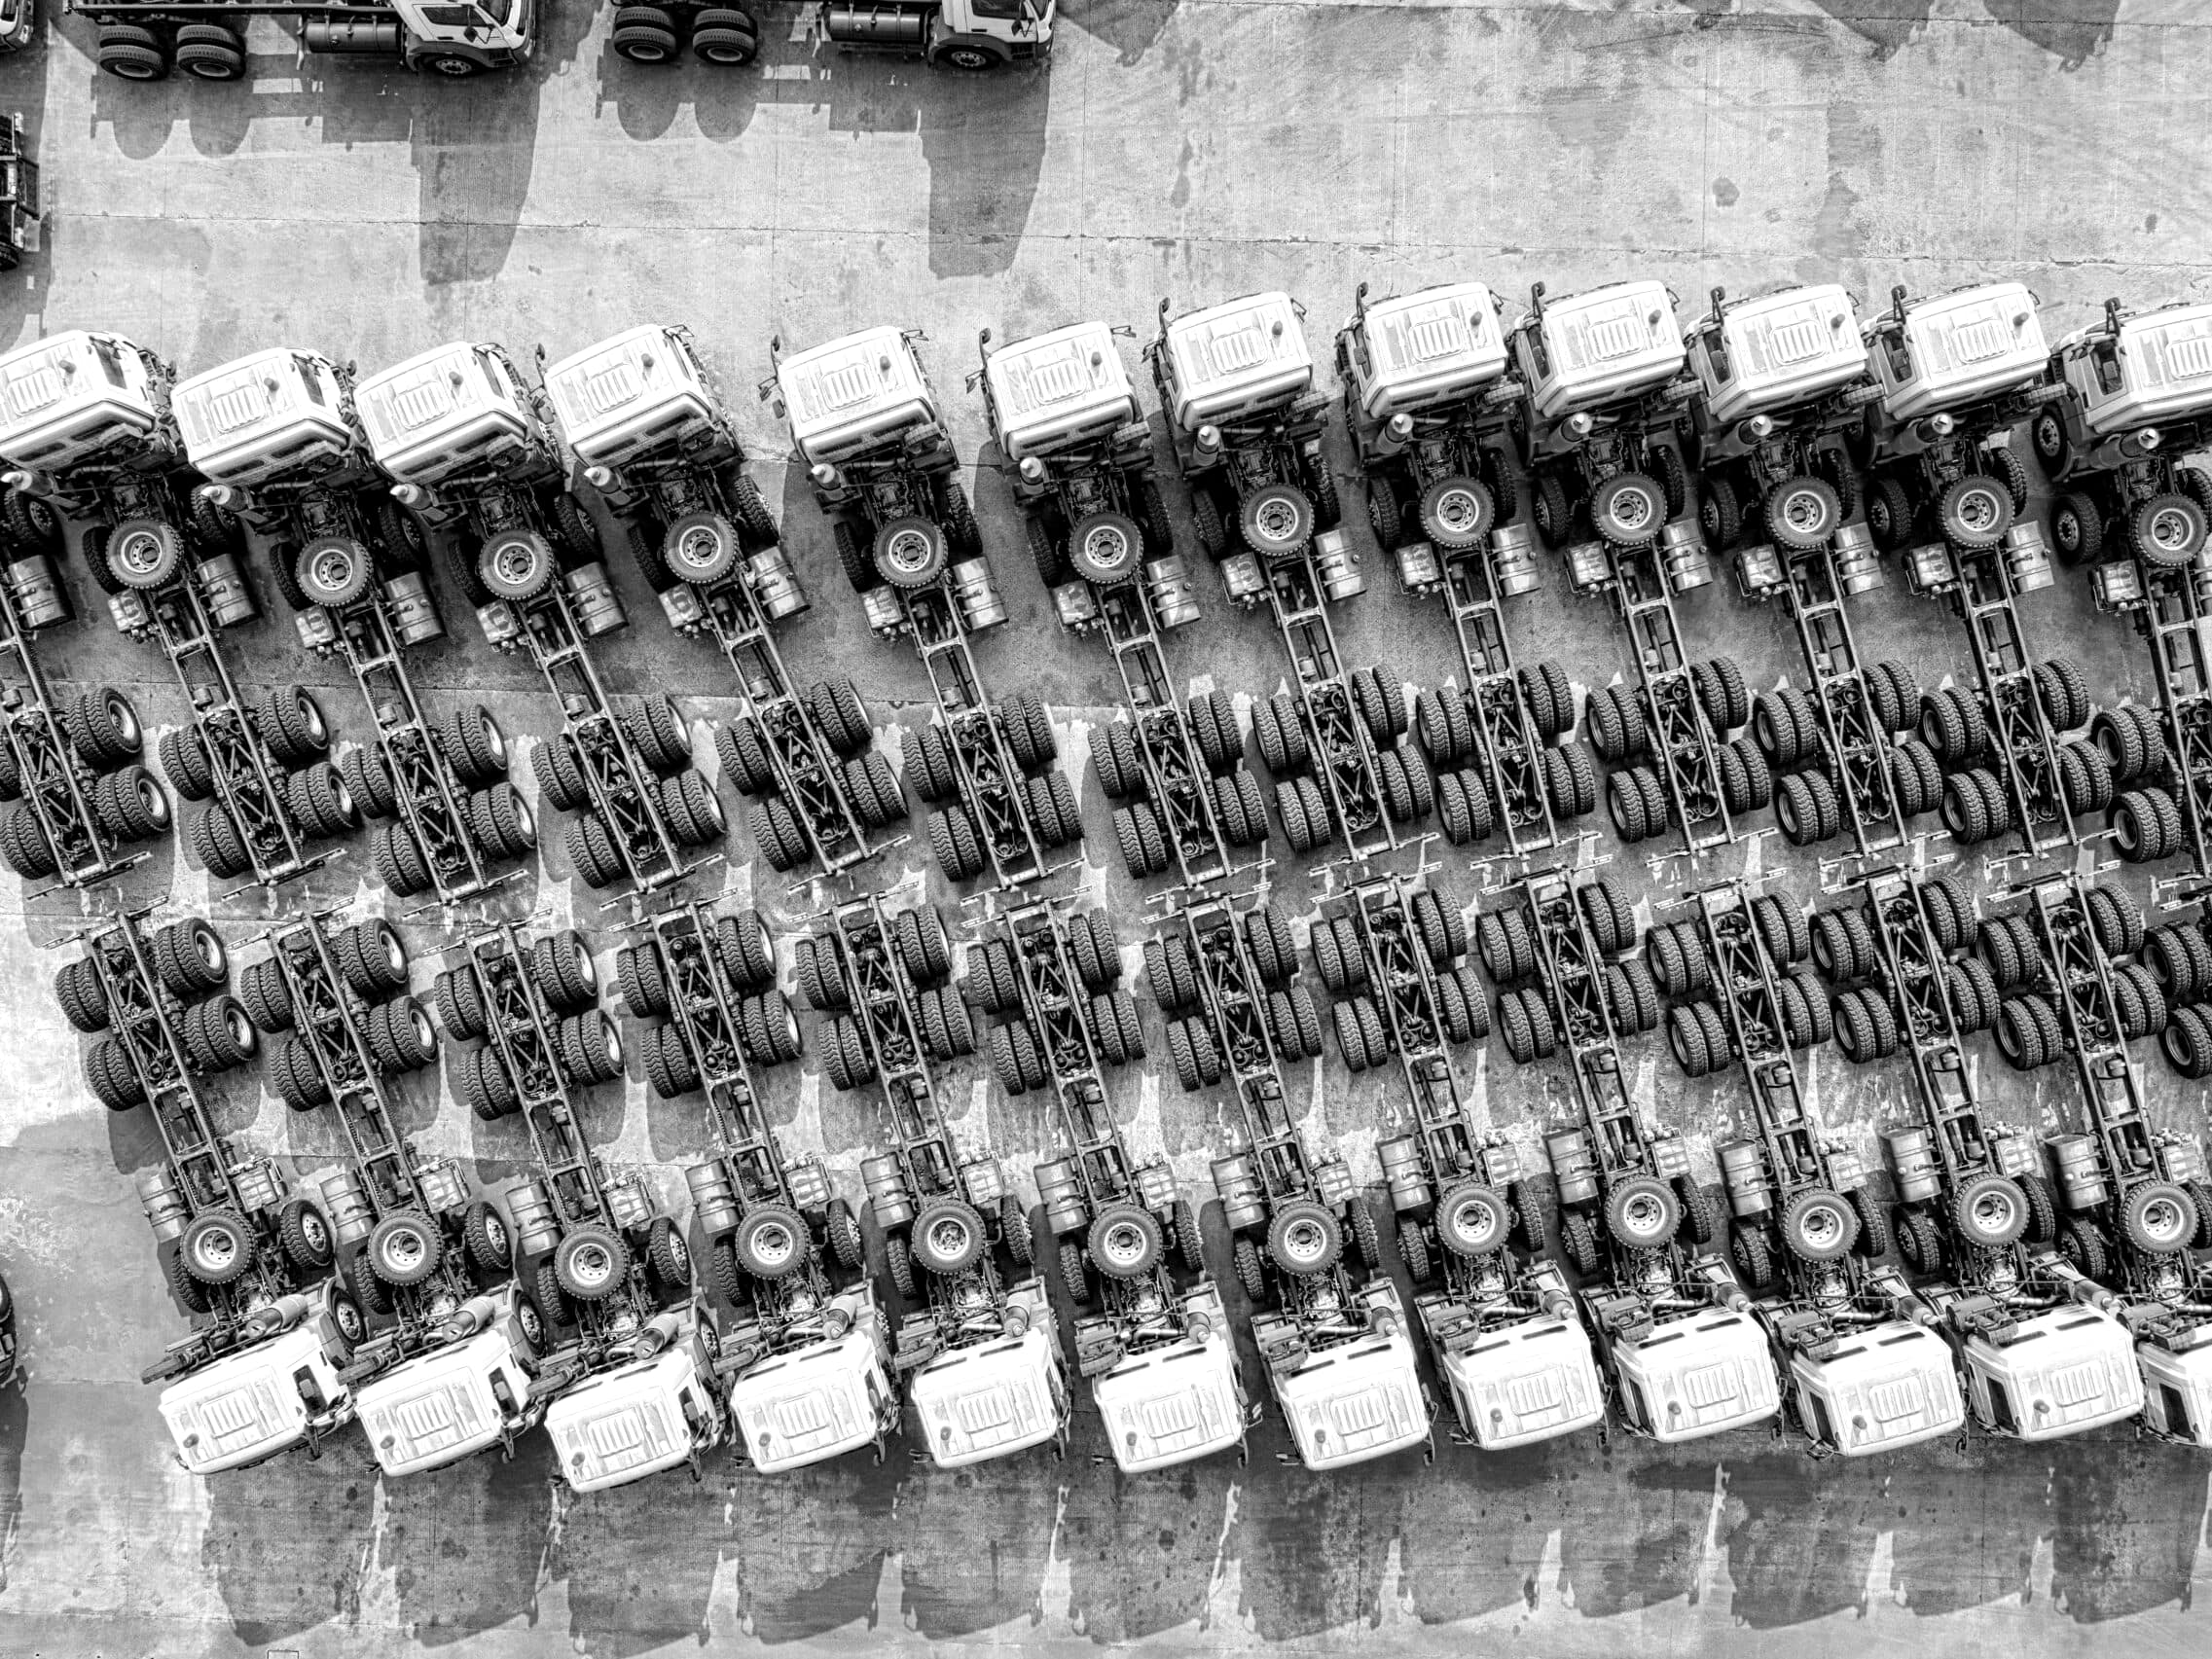
The tenant is a trucking company, a contractor, an equipment rental business or a utility fleet. Their operation is built around being where they are, minutes from the interstate and the customers they serve. There is rarely a comparable site to move to, which is why renewal rates in this asset class are high and why in-place rents are so often below what the site is worth.
Demand is also more diversified than the sector label suggests. Construction and building materials account for roughly a fifth to a quarter of it, logistics and trucking about the same, with equipment rental and utilities infrastructure behind them. Those businesses do not move through the cycle together, which is the source of the diversification.
As institutional ownership has increased, lease documentation has strengthened with it. Leases that ran two to three years in 2023 are being written at four to six years now, build-to-suit at seven to ten, with 3% to 4% annual escalators as standard. Weighted average lease terms across institutional portfolios have gone from about two and a half years in 2022 to over four and a half today. Longer weighted average lease terms support valuation, and that is being reflected in pricing.
Low Capital Intensity
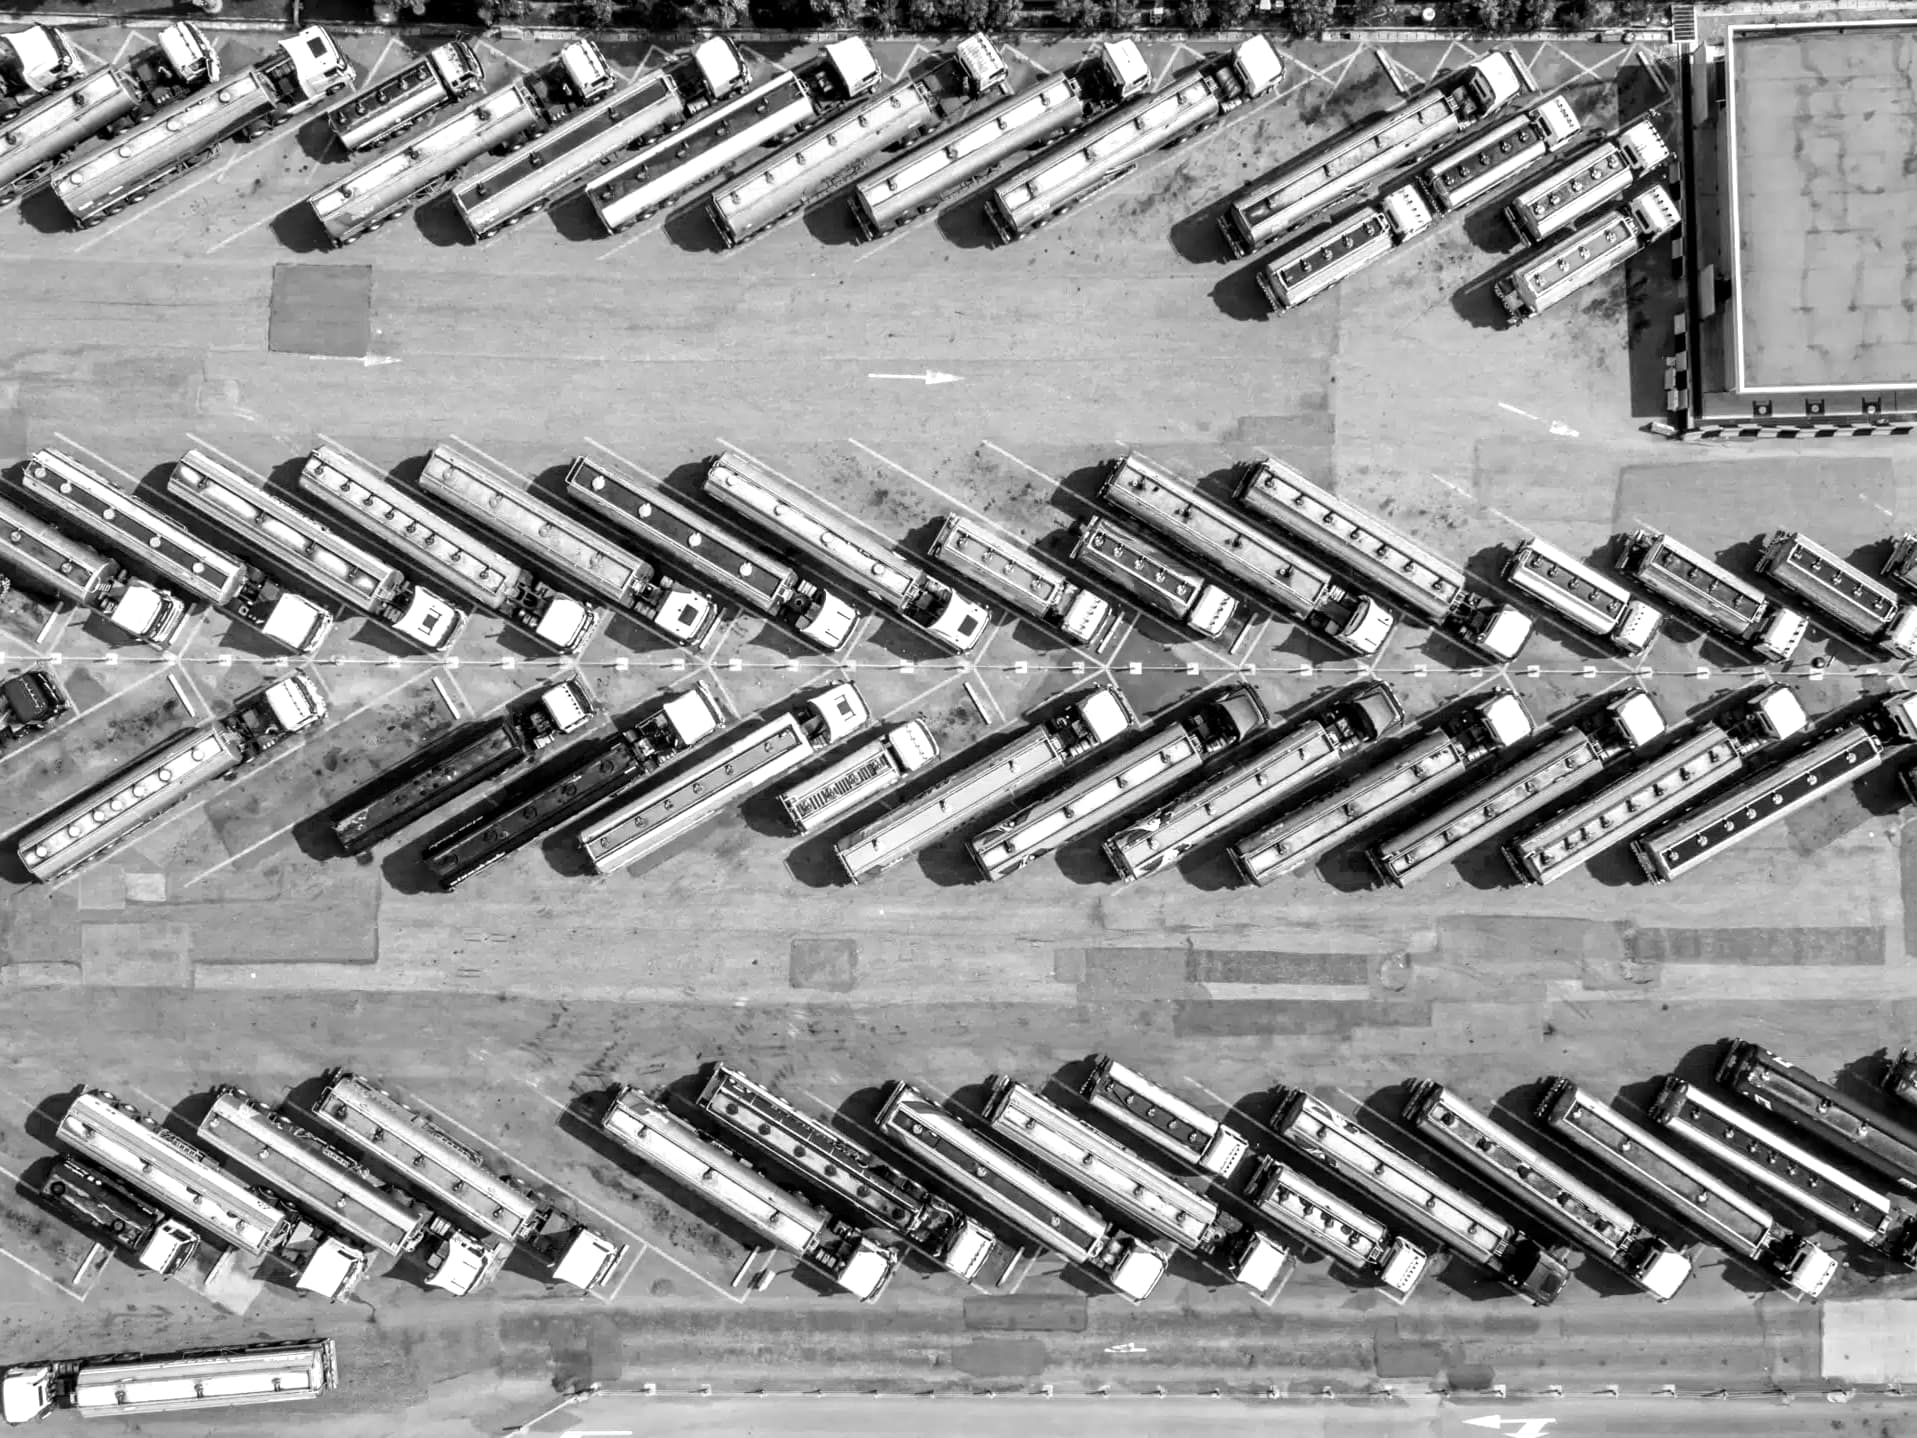
A yard carries no roof to replace, no elevator to modernize and no lobby to refurbish. Capital expenditure is fencing, surfacing and lighting. Leases are typically net, so taxes, insurance and maintenance sit with the tenant. A high proportion of gross revenue therefore converts to net operating income.
Functional obsolescence is also largely absent. A building dates through its clear height, its dock configuration and its power capacity; surfaced land does not. The improvements we make are low cost relative to their effect on rent, which inverts the usual trade in value-add real estate.
The Spread Between Development Yield and Stabilized Pricing
A formal development pipeline has started, still modest at around 3% to 5% of inventory. The relevant signal is the spread it reveals. Development yields meaningfully more than acquisition of a stabilized site, which indicates that stabilized pricing has not yet been competed away.
Replacement cost for an improved site runs roughly $250,000 to $400,000 per usable acre, with land at 40% to 60% of it. Anything we can buy and improve materially below that number carries its margin of safety in the basis rather than in the forecast. We would rather acquire below replacement cost than build to it, and we will not develop in pursuit of that spread.
Development yield
primary markets
7.5% to 9.5%
Development yield
secondary markets
8.5% to 10.5%
Stabilized cap rate
primary markets
6% to 6.75%
Stabilized cap rate
secondary markets
6.75% to 7.75%
Source: Matthews Real Estate Investment Services, 2026 IOS Sector Update, March 2026. Market estimates, not Videre results.
Where We Buy
The same corridor as our manufactured housing program, so one team covers both. Atlanta, Charlotte, the Upstate, Nashville, Memphis and Dallas-Fort Worth. Sites near the interstate, near the intermodal terminals, and near the distribution footprint that has been built out across the Southeast over the last decade.
Dallas-Fort Worth is the market we treat as the sector’s bellwether. It is one of the few places carrying both kinds of demand at once: freight moving through a gateway hub, and the builders, rental yards and infrastructure crews that serve a population growing at 2% to 2.5% a year. Most markets carry one or the other. Vacancy in the northern submarkets sits around 4% to 5%, and core rents run roughly $6,500 to $13,000 per acre per month against $3,000 to $6,000 in secondary markets.
Outlook
The yield premium that first made the sector attractive is being competed away. It was commonly quoted at 100 to 250 basis points over traditional industrial a few years ago; the current estimate is 25 to 75. That compression reflects the sector being repriced from niche to institutional, and it occurs once.
The durable component is what does not compress: under 2% annual supply growth, entitlements that are getting harder rather than easier, and a tenant base whose rent is a few percent of what it spends to operate. Freight volumes are still below their 2022 peak and are expected to normalize through late 2026 and into 2027, which would support leasing rather than restrain it.
The opportunity we are underwriting is the ownership split. While two thirds of the sector remains with private operators and owner-users, an attractive basis is available to buyers willing to execute small, unglamorous transactions with discipline. That is the window we are buying in, and we expect it to close.
What We Avoid
We do not buy environmental legacy without a clean assessment and a known cost. We do not buy a site that works only for its current tenant and has no second use. We do not buy land on the expectation of a rezoning. And we do not bank land, which is a speculative position rather than an investment.